6
5 but less than 7 percent
9
7 but less than 10 percent
11
10 but less than 14 percent
17
14 percent and greater
Figure 1-8. Slope Symbol
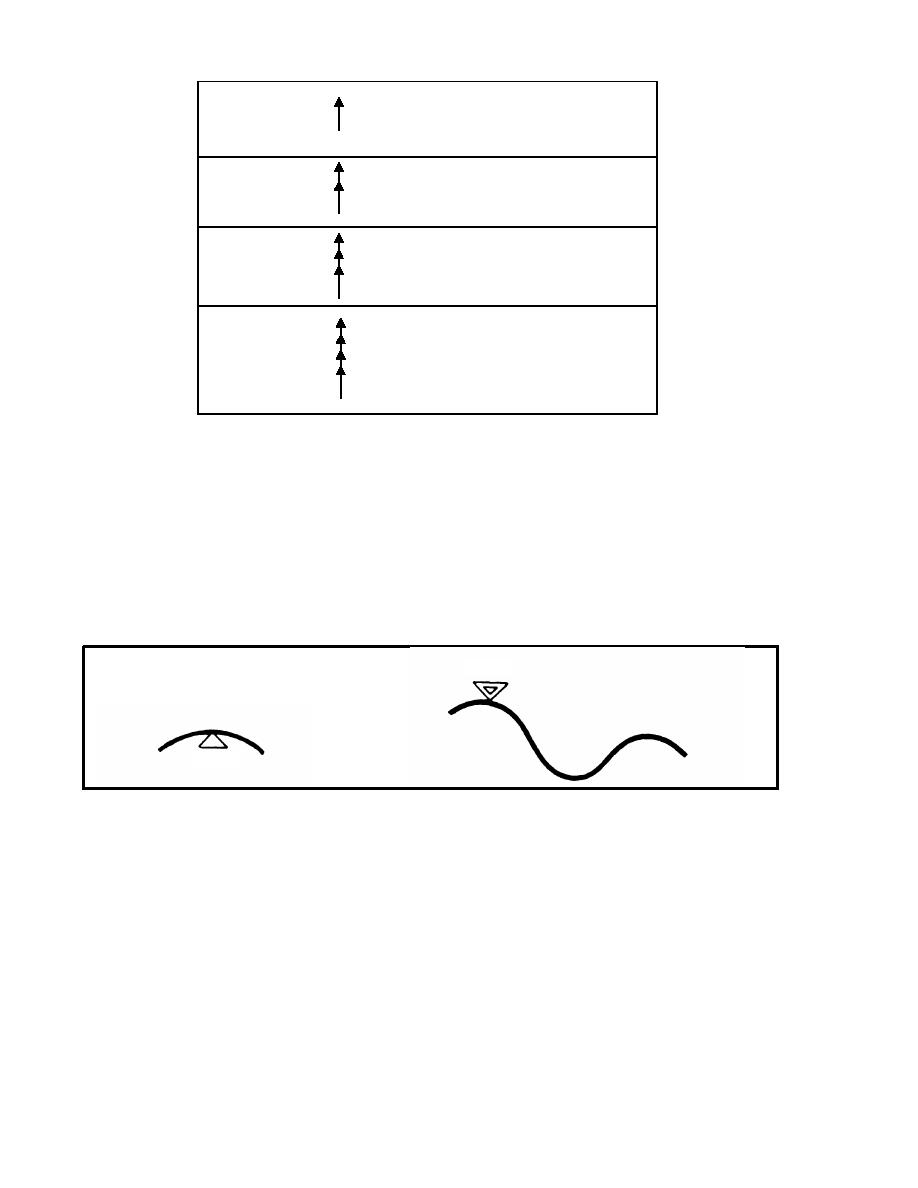
1-10. Curve Symbol. Sharp curves along a specified route with a radius of 45 meters and
less are represented on maps or overlays by a triangle. The vertex (the point opposite to and
farthest from the base) of the triangle will point to the geographical location of the curve on
the overlay or map. In addition, the measured value (in meters) for the radius of curvature
is written outside the triangle. A series of sharp curves is represented by two triangles, one
drawn inside the other. The vertex of the outer triangle points to the geographical location
of the curve. The number of curves and the radius of curvature at the sharpest curve of the
series are written outside the triangle (Figure 1-9).
3/25
22
Figure 1-9. Curve Symbols
1-11. Tunnel Symbol. The tunnel symbol (Figure 1-10), like the underpass symbol, is
drawn to show the actual shape of the tunnel portal. The geographical location is shown on
the overlay by a leader arrow coming off the symbol pointing to the entrance of the tunnel.
A serial number is assigned to each tunnel to aid in later reference to a specific tunnel. The
serial number is recorded in the inside of the tunnel symbol (for example, T-1, T-2, T-3, and
so on). The overhead clearance is shown on the left side of the symbol. If the overhead
clearance varies, both the minimum and the maximum are given. The overall tunnel length
(in meters) is recorded on the right side of the symbol. The traveled-way width (in meters)
is recorded beneath the symbol. If sidewalks are present, they are drawn in the symbol. The
traveled-way width (plus the sidewalk widths) will be shown with the traveled-way width
beneath the symbol.
EN 5621
1-6


 Previous Page
