FRAME 71.
We can also find the value on the horizontal base line when we are given the areas under the
curve less than or greater than that amount. For instance, suppose we wanted to find the height
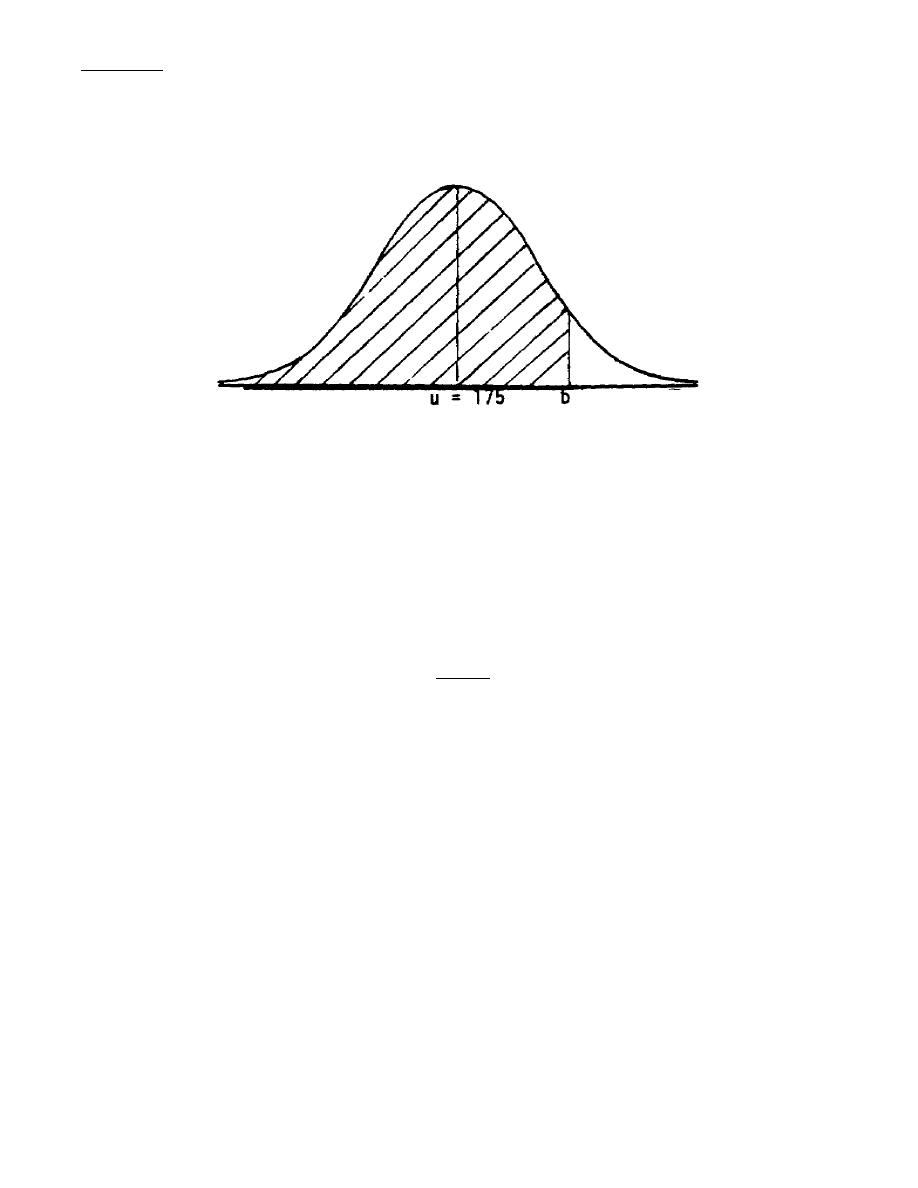
below which 90% of all trainees fell. We would draw a diagram as follows:
find b when the shaded area is 90%, we must first determine the area between u and b. Since
the entire area is 90%, and the area below u is 50%, the area between u and b is: 90% - 50% =
40%. Converting to decimal form, we look in the table for .4000. As you might recall, that area
falls between .3997 (z= 1.28) and .4015 (z= 1.29). Our rule says that we must use the larger z
value if our area falls between two areas on the table, so z = 1.29 for an area of .4000.
Using the formula from Frame 70 for values above the mean:
b= u+ zσ
= 175 + 1.29 (6)
= 182.74
In other words, 90% of the time, recruits will be less than or equal to 182.74cm in height.
QUESTION:
Above what height will 95% of all recruits be? _______________________________
105
FI0921


 Previous Page
