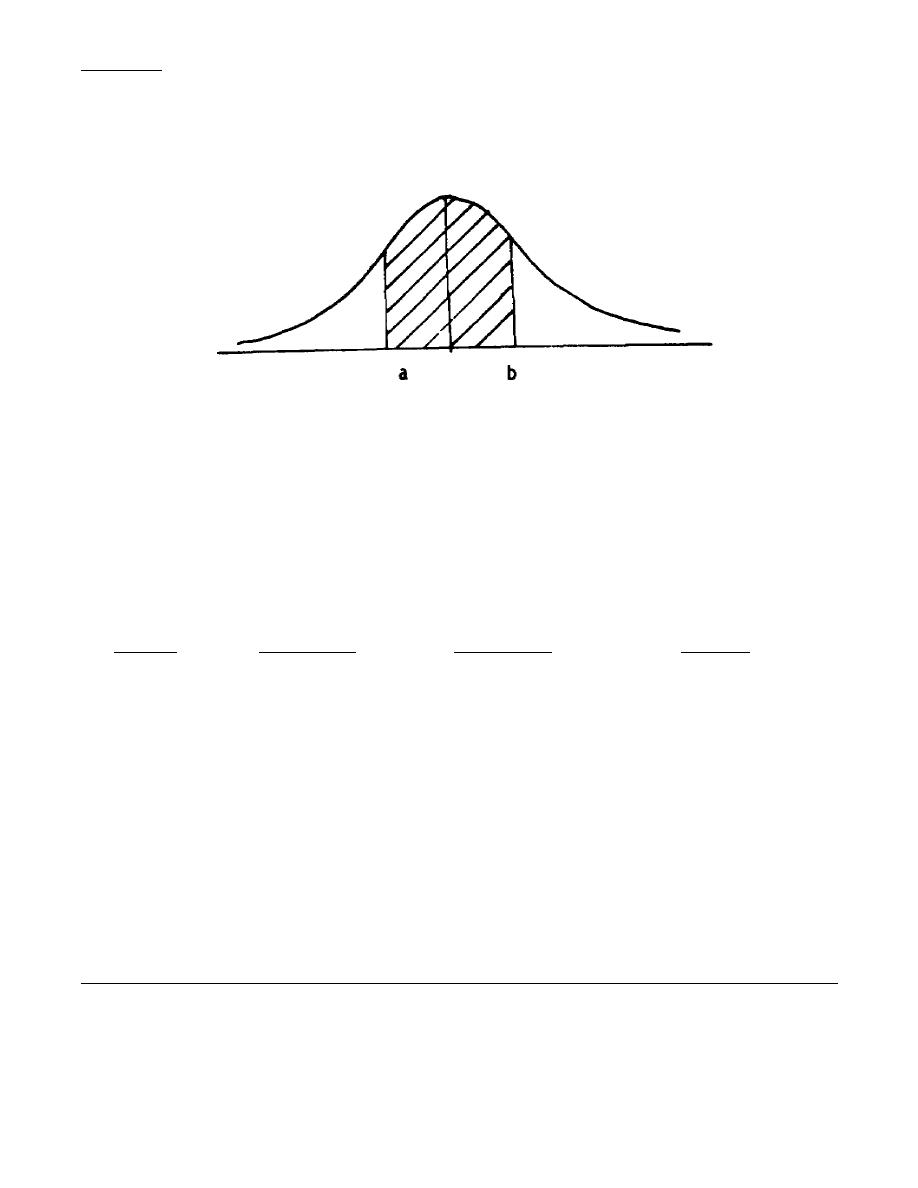
FRAME 69.
Often we know the area under the curve and want to find the associated values on the
horizontal base line. For example, the middle 80% of all trainees could be expected to have
heights between what two values? Unless otherwise specified, it is assumed the given area is
centered on the mean. A diagram would appear as follows:
u = 175
The shaded area is 801 (in this case) of the total area and the distance from a to 175cm is the
same as the distance from 175cm to b. We want to find values for a and b. By symmetry, the
shaded area on each side of the mean is 40% (half of 80%). Recall the construction of the table
of areas under the normal curve. The perimeter values give standard deviations and the body of
the table gives areas. In this case, we will work in the opposite direction. Instead of knowing
standard deviations and looking up the corresponding area, we will know the area and look up
the corresponding standard deviation. In our example, we will look up an area of .4000. From the
table we see that no entry is exactly .4000. We will use the higher z value if the area (%) falls
between two areas (%) on the table. For an area of .4000, the z value would be 1.29.
Initial Area
Lower Area (A)
Higher Area (%)
Value
__ Value__
__ and Value__
__ and Value__
Selected
.4500
.4495
.4505
1.64
1.65
1.65
.4000
.3997
.4015
1.28
1.29
1.29
.3400
.3389
.3413
.99
1.00
1.00
.2500
.2486
.2518
.67
68
.68
.2075
.2054
.2088
.54
55
.55
102
FI0921


 Previous Page
