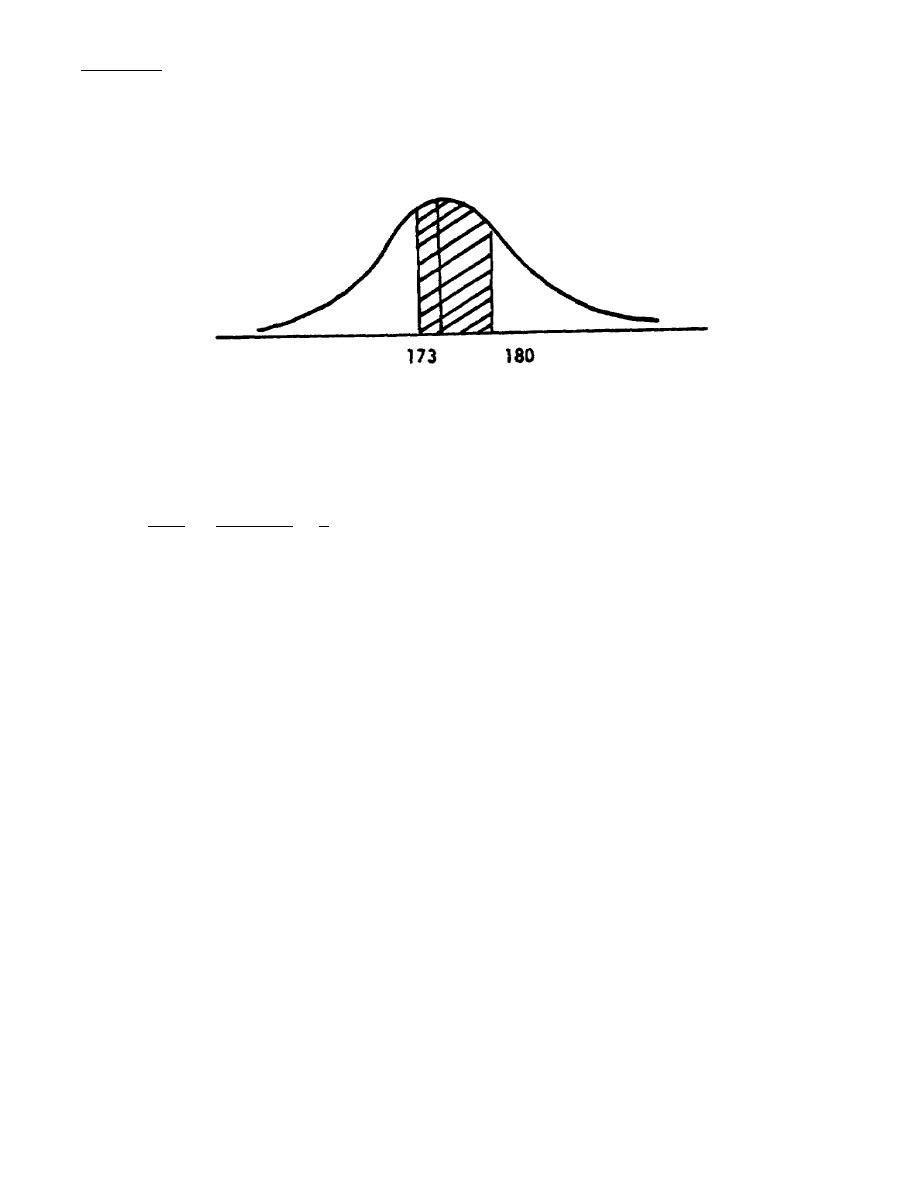
FRAME 66.
The table value for the area under the normal curve corresponding to -.33 standard deviation
from the mean is .1293. The area between 165cm and 173cm is .4525 - .1293 = .3232. Thus we
can expect 32.32% of the 10,000 recruits to require Size B uniforms, which is 3,232. For Size C
the area of interest would be:
u = 175
We already know that 12.93% of the area lies between 173cm and 175cm. Using the z
equation we can find the number of standard deviations from u = 175cm to 180cm:
z = X - u = 180 - 175 = 5 = .83
σ
6
6
The table value for .83 standard deviations above the mean is .2967. Then the area between
173cm and 180cm is .1293 + .2967 = .4260. We would expect 42.60% of the recruits to require
Size C uniforms. Thus, we can expect 4,260 (.426 x 10,000 = 4,260) recruits to require Size C
uniforms.
QUESTION:
What percent of the recruits would take a Size D uniform? Draw the diagram.
97
FI0921


 Previous Page
