FRAME 64.
It is good procedure to draw a picture or diagram of the problem that includes all available
information. The diagram makes it easier to visualize which part of the normal curve you are
interested in. Also, after solving the problem, the diagram serves as a quick check to see if your
answers are reasonable."
You are responsible for ordering uniforms for the 10,000 recruits expected to be trained at
Fort Flatland next year. Size of the uniforms ordered depends on height in centimeters. There
are five sizes available. Please note that our sizes overlap at the extremes (end of one, beginning
of the other). We are using numbers here that are easily manipulated when performing the
necessary subtractions and divisions. You should assume, then, that we are dealing with five
gradations where size A ends at 164.9 and size 8 begins at 165, and so on. In doing the
computations, however, use the numbers that are given.
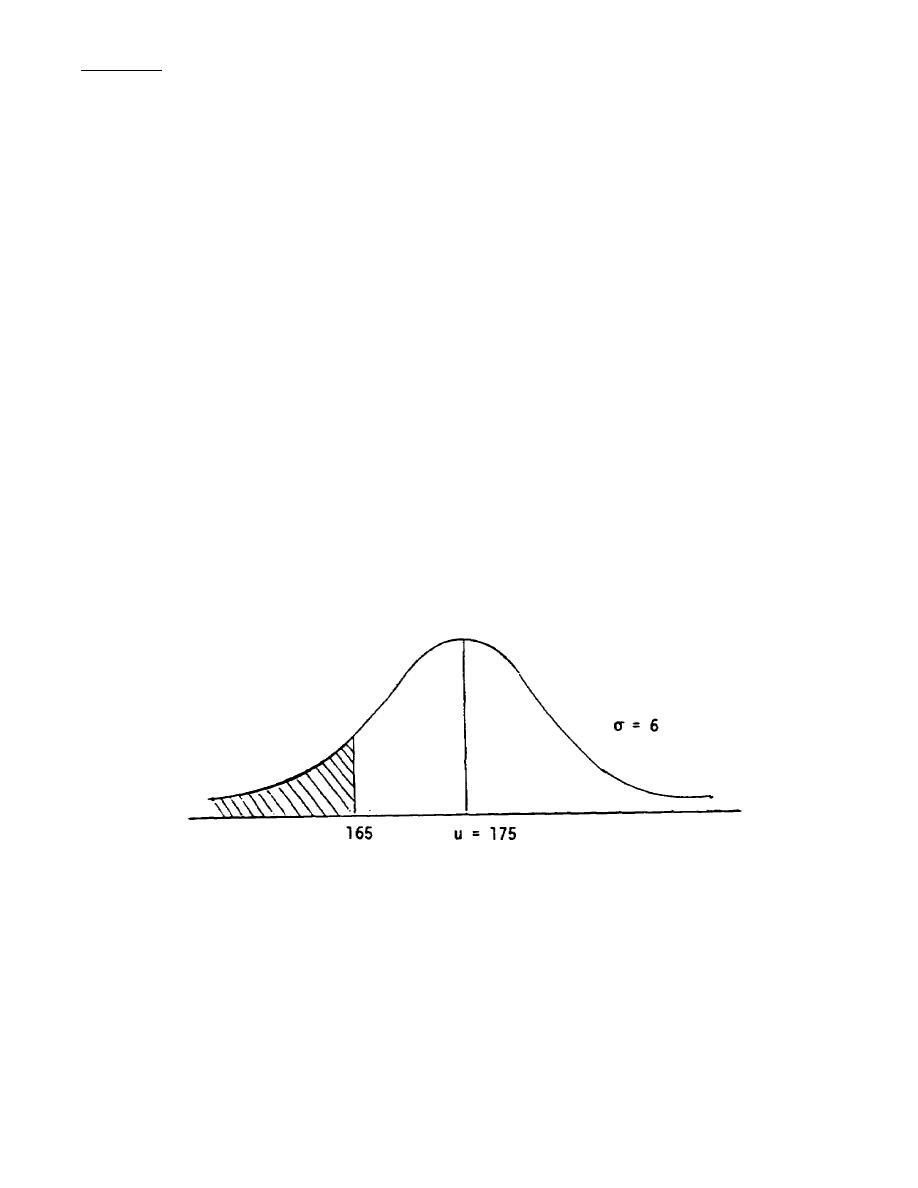
Size A fits recruits having a height of 165cm or less.
Size B fits recruits 165cm to 173cm tall.
Size C fits recruits 173cm to 180cm tall.
Size D fits recruits 180cm to 191cm tall.
Size E fits recruits 191cm or taller.
Past history has shown that the heights of recruits tends to be normally distributed with u =
175cm and σ = 6cm. How many uniforms of each size should be ordered?
Consider Size A first. A diagram with the area of interest shaded would appear as:
95
FI0921


 Previous Page
