
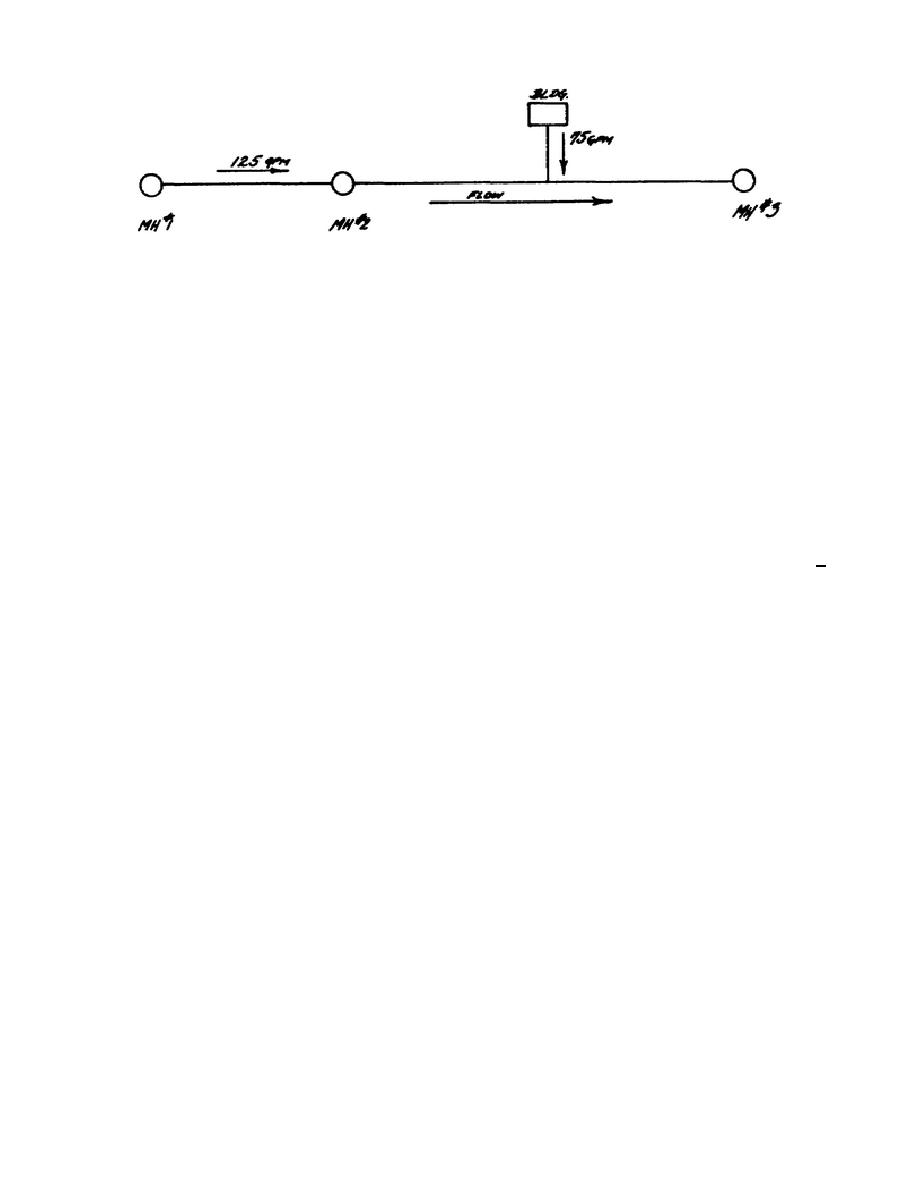
Figure 13.
Section of collection systems.
figure of 2 gallons per minute per
right hand sides of the chart are flow
1,000 feet of sewer may be assumed for
rates. MGD stands for million gallons
infiltration.
Of
course
if
any
per day, gpm is gallons per minute,
information on infiltration in the
and cfs is cubic feet per second.
area is available from other sources
Along the top and bottom of the chart
(such as sewer systems already in
is slope in feet per hundred which is
operation nearby) then that value
also percent.
Inside the chart are
should be used.
lines moving up and to the right.
These lines are different pipe sizes
14. SLOPE DETERMINATION
and range in size from 4-inch to 48-
inch
diameter.
The
lines
Since the easiest excavation is along
perpendicular to the pipe size lines
the natural ground slope, the sewer
are velocity lines and range from 1
system is most easily placed along the
foot per second (fps) to 12 feet per
slope of the ground.
This slope is
second.
The pipe chosen must handle
usually used as a first estimate for a
at least as great a flow at the chosen
pipe
slope.
If
this
slope
is
slope as the actual flow found in 13b.
unacceptable (usually because it is
To find a pipe size which will do
obviously too small or too great, or
this, enter the chart on the left or
because it does not give an acceptable
right side at the actual flow rate.
velocity) a new slope must be tried.
Draw a horizontal line until the
It is often at this point that drop
chosen slope is intersected. The pipe
manholes should be considered.
size below this point of intersection
is too small.
The pipe above this
15. PIPE SIZE
point must be used.
As an example,
find a pipe size to handle an actual
Once a slope is chosen, the pipe size
flow of 300 gallons per minute at 1-
necessary can be determined by use of
percent slope. Enter the chart at 300
formulas or charts. The formulas that
gallons
per
minute
on
the
right
are most commonly used for sewer
and
move
horizontally
to
the
design are Kutter's formula and the
left
until
the
1-percent
slope
Manning formula.
The form of the
line
is
intersected.
The
point
Manning formula is somewhat simpler,
of intersection is above the 6-inch
but the results less accurate for pipe
diameter
pipe
and
below
the
sizes smaller than 12 inches.
Figure
8-inch pipe.
Therefore, 6-inch pipe
14 is a pipe-flow chart based on
cannot handle 300 gallons per minute
Kutter's
formula.
It
should
be
at
a
1-percent
slope
and
8-inch
understood that this chart is for
diameter
pipe
must
be
used.
pipes running full.
The left and
Figure 14.
Pipe flow chart (issued as separate item).
4-19

 Previous Page
