The minimum sizes which may be used
1 percent. At the intersection of the
for
TO
construction
are
4-inch
1-percent line and the 8-inch diameter
diameter pipe for a house connection
line, a line is drawn parallel to the
and 6-inch diameter pipe for any other
velocity lines.
The new line lies
sewer.
between the line of 3 feet per second
and 3.5 feet per second. Its value is
16. ACTUAL VELOCITY
3.2 feet per second.
The acceptable limits for the sewage
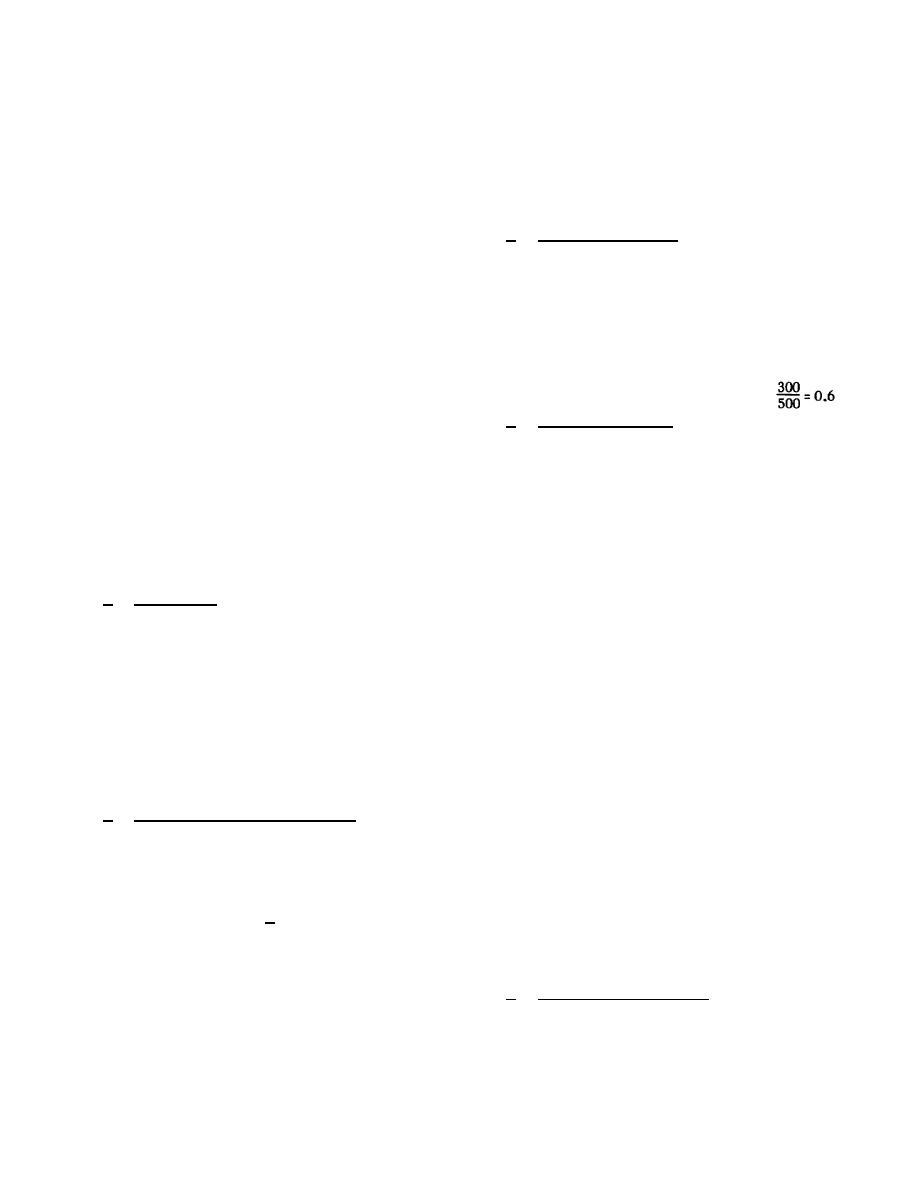
c. Discharge ratio.
The discharge
velocity are 2 feet per second to 10
ratio is the ratio of the actual
feet per second.
Velocities lower
discharge (flow) (QA) to the full
than this will tend to deposit solids
discharge (Qc).
Thus the discharge
in the sewer and velocities higher
ratio is found by dividing the actual
will scour out the invert of the
flow by the full flow.
For the
sewer.
Occasionally a choice is
example started above the actual flow
forced upon the designer of using a
is 300 gallons per minute and the full
lower velocity than 2 feet per second
flow
is
500
gallons
per
minute.
or of putting in an automatic lift
Therefore the discharge ratio is
station. If it can be shown that the
costs incurred in keeping the sewer
d. Velocity ratio.
The velocity
clean, and perhaps replacing it, are
ratio is the ratio of the actual
cheaper over the design life of the
velocity (Va) to the velocity at full
system
than
the
procurement
and
flow (Vc). Since Va is not known yet
maintenance cost of the lift station
this cannot be found by division. The
or other special facility, then the
velocity ratio is found by use of
actual velocity may be decreased to
figure 15.
The chart is used by
1.5 feet per second at peak flow.
entering along the top or bottom at
There are five steps to finding actual
the value of the discharge ratio.
velocity.
Move vertically along the discharge
ratio value until the discharge curve
a. Full flow. The full capacity of
is intersected.
From this point move
the sewer is found by entering the
horizontally to the right until the
chart at the given slope and moving
velocity curve is intersected.
At
all the way up to the chosen pipe
this point move vertically up or down
size.
Moving horizontally to the
and read the velocity ratio at the top
right
from
this
point
the
full
or
the
bottom
of
the
chart.
capacity can be read.
Continuing the
Continuing the example, the chart is
example started above, the chart is
entered along the bottom at the value
entered at the 1-percent slope line.
of discharge ratio 0.6.
Moving up to
Moving up to the 8-inch line and
the discharge curve, across to the
reading to the right, a full flow of
velocity
curve,
and
down
to
the
500 gallons per minute is obtained.
bottom, a value of 1.045 is read.
Thus the velocity ratio is 1.045. The
b. Velocity at full flow.
The
only case where this method of using
velocity at full capacity is found by
figure 15 gives an incorrect answer is
entering the chart at the design
when the discharge ratio is 1.0.
slope.
Move up vertically until the
However, when this is the case the
design
pipe
size
is
intersected.
actual velocity must be equal to the
(This point of intersection is the
full flow velocity because the pipe is
same point found in a above.) Through
flowing full.
Since the velocities
this point draw a line parallel to the
must be equal, the velocity ratio is
velocity lines.
Knowing the velocity
1.
value of the line above and below, an
estimate of the velocity value of the
e. Actual
velocity.
The
new line can be made.
This is the
velocity
ratio
is
the
actual
velocity at full flow.
For the
velocity
divided
by
the
full
example above, the chart is entered at
4-20


 Previous Page
