Lesson 6/Learning Event 4
Step 2. Select the Screen Sizes to be Used in the Gradation Unit.
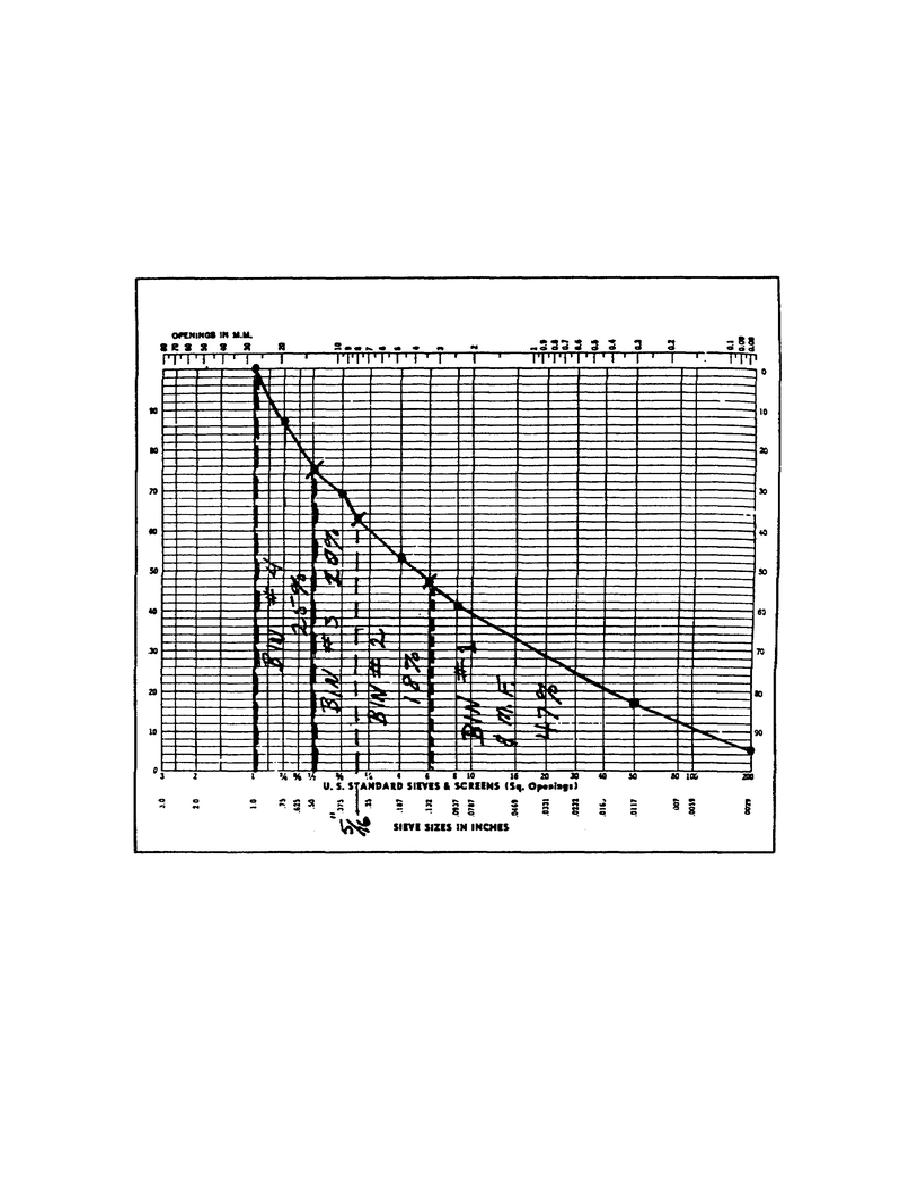
the aggregate chart (Figure 20).
FIGURE 20. CONCRETE/BITUMINOUS MIX DESIGN-AGGREGATE
The curve formed by the graph is an indication of aggregate gradation balance and the resulting
mix stability. The curve also assists in determining the aggregate to be proportioned into each
gradation unit, bin, and the selection of screen sizes. The curve is plotted on a standard gradation
chart having vertical lines which represent the aggregate, or sieve, sizes and horizontal lines to
designate the percent of aggregate passing each sieve size. The gradation curve is cumulated
from 0% to 100% in 2% increments, showing a passing and retained gradation. The curve that Is
plotted depicts the desired ag-
81


 Previous Page
