___________________________________________________ Principles of Transmission Lines
3-113. The voltage at the center and the ends varies at a sinusoidal rate
between the limits shown. At the one-fourth and three-fourths points, the
voltage is always zero. A continuous series of diagrams such as these is
difficult to see with conventional test equipment, which reads the effective or
average voltage over several cycles. The curve of amplitude over the length of
line for several cycles is shown in figure 3-29, view B. A meter will read zero
at the points shown and will show a maximum voltage at the center, no
matter how many cycles pass.
3-114. As shown in figure 3-29, view D, the amplitude varies along the
length of the line. In this case it is zero at the end and center but maximum
at the one-fourth and three-fourths points. The entire diagram of the open-
ended line conditions is shown in view E. The standing waves of voltage and
current appear together. Observe that one is maximum when the other is
minimum. The current and voltage standing waves are one-quarter cycle, or
90 degrees, out of phase with one another.
Reflection of AC Voltage from a Short Circuit
3-115. Reflection is complete when an RF line is terminated in a short
circuit, but the effect on voltage and current differs from the effect obtained
in an open-ended line. Voltage is reflected in opposite phase, while current is
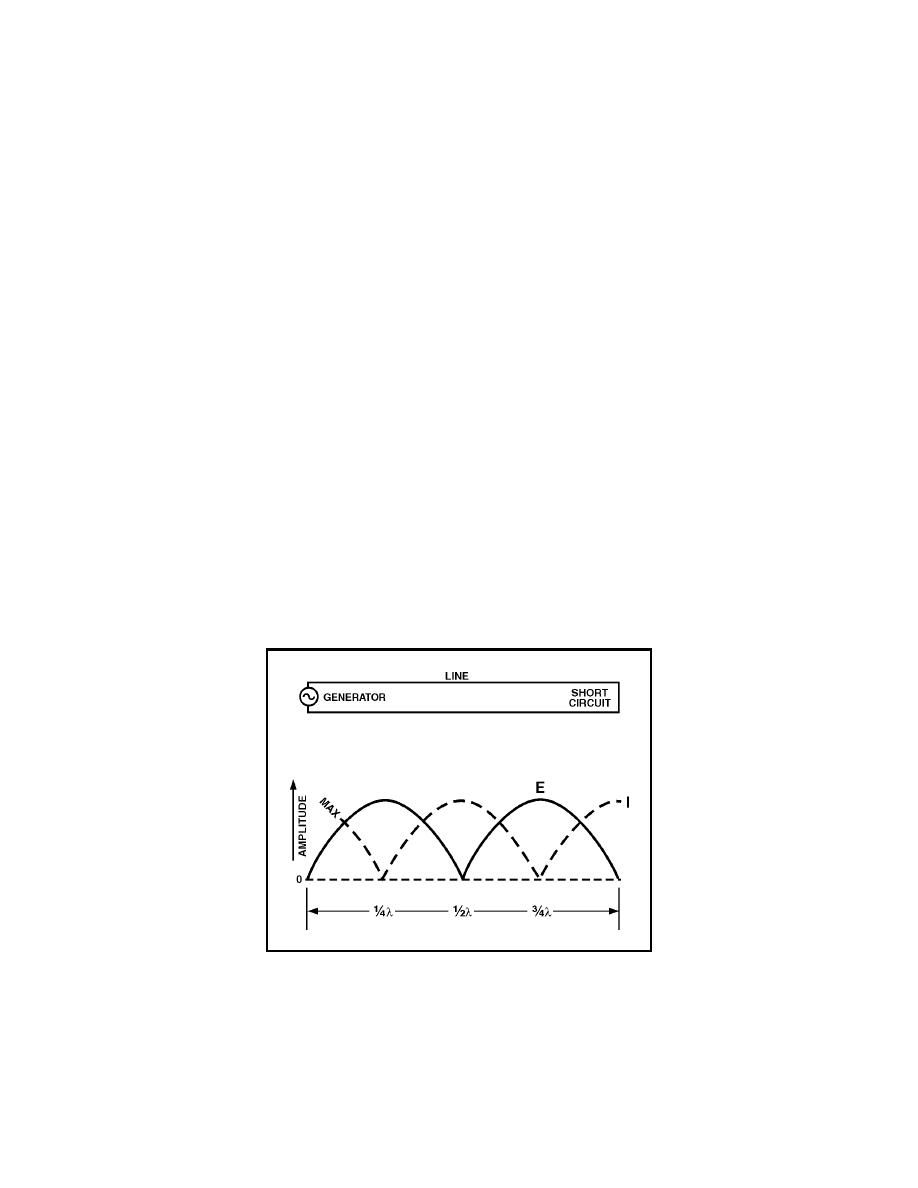
reflected in phase. Again look at the series of diagrams in figure 3-27. The
left column represents current, and the right column shows voltage changes
on the shorted line. The standard representation of standing waves on a
shorted line is shown in figure 3-30; the voltage is a solid line, and the
current is a dashed line. The voltage is zero at the end and center (1/2λ) and
maximum at the 1/4λ and 3/4λ points, while the current is maximum at the
end and center and minimum at the 1/4λ and 3/4λ points.
Figure 3-30. Standing Waves on a Shorted Line
3-116. As previously discussed, there are several differences between open
and shorted lines in the voltage and current waves on transmission lines.
Basic differences also appear in the standing-wave patterns for open and
shorted lines. You can see these differences by comparing figure 3-29, view E
3-37


 Previous Page
