ANSWER TO FRAME 58.
a. = +1
b. = -2
FRAME 59.
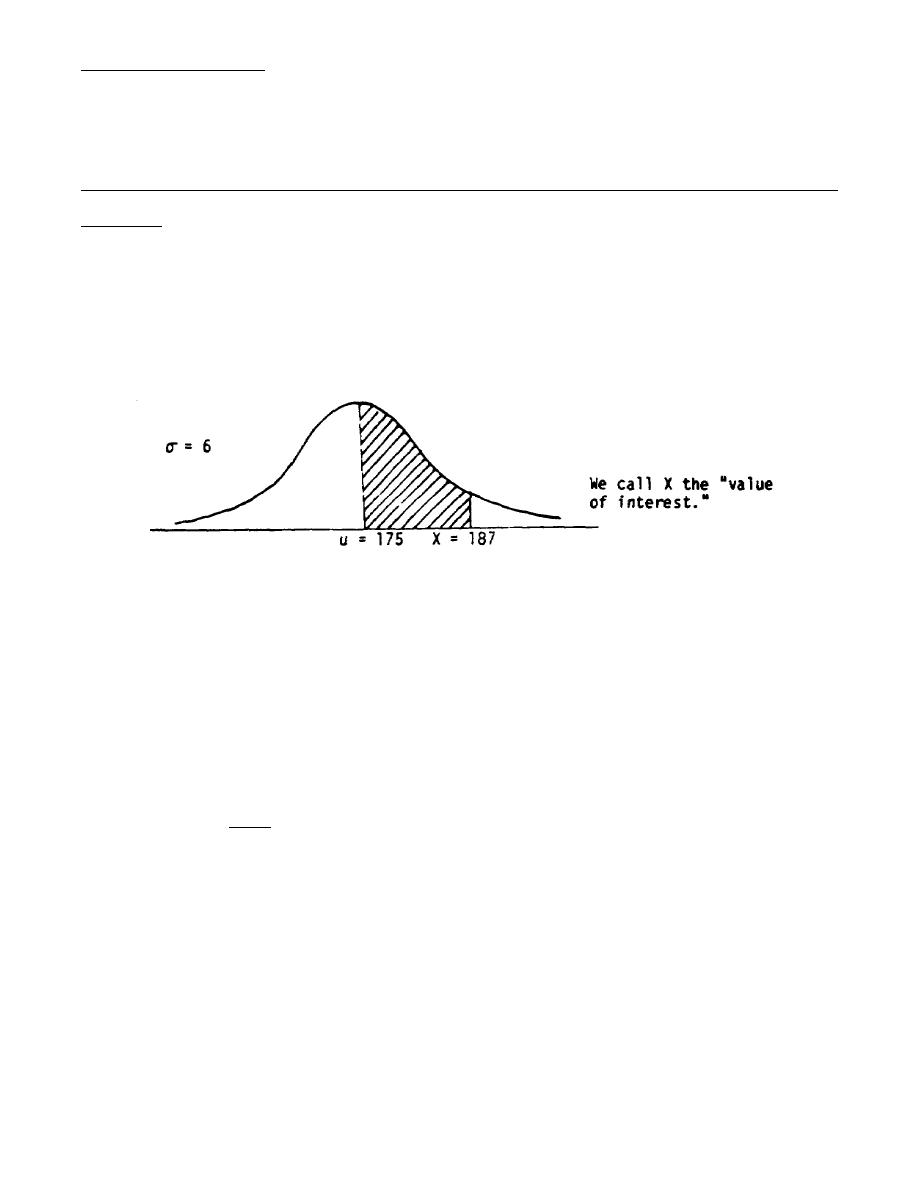
Suppose we had evidence that the heights of recruits followed a normal distribution with a
mean of 175cm and a standard deviation of 6cm. We are interested in finding what percent of
the population of all recruits have heights between 175cm and 187cm. A diagram would look
like:
To answer the question we need to find the shaded area. We know there is a relationship
between the area under the normal curve and the distance along the horizontal base line
measured in standard deviations from the mean (or z"s).
The distance from u = 175cm to X = 187cm is 12cm. The value of one standard deviation is
σ = 6cm. Then the distance in question along the horizontal axis must be 12/6 = 2 standard
deviations from the mean, or z -2. We can formalize this thought process with the following
formula:
z= X= u
where,
σ
z = number of standard deviations from the mean.
u = mean of the population.
σ = standard deviation of the population
X = value of interest.


 Previous Page
