FRAME 57.
THE z SCORE
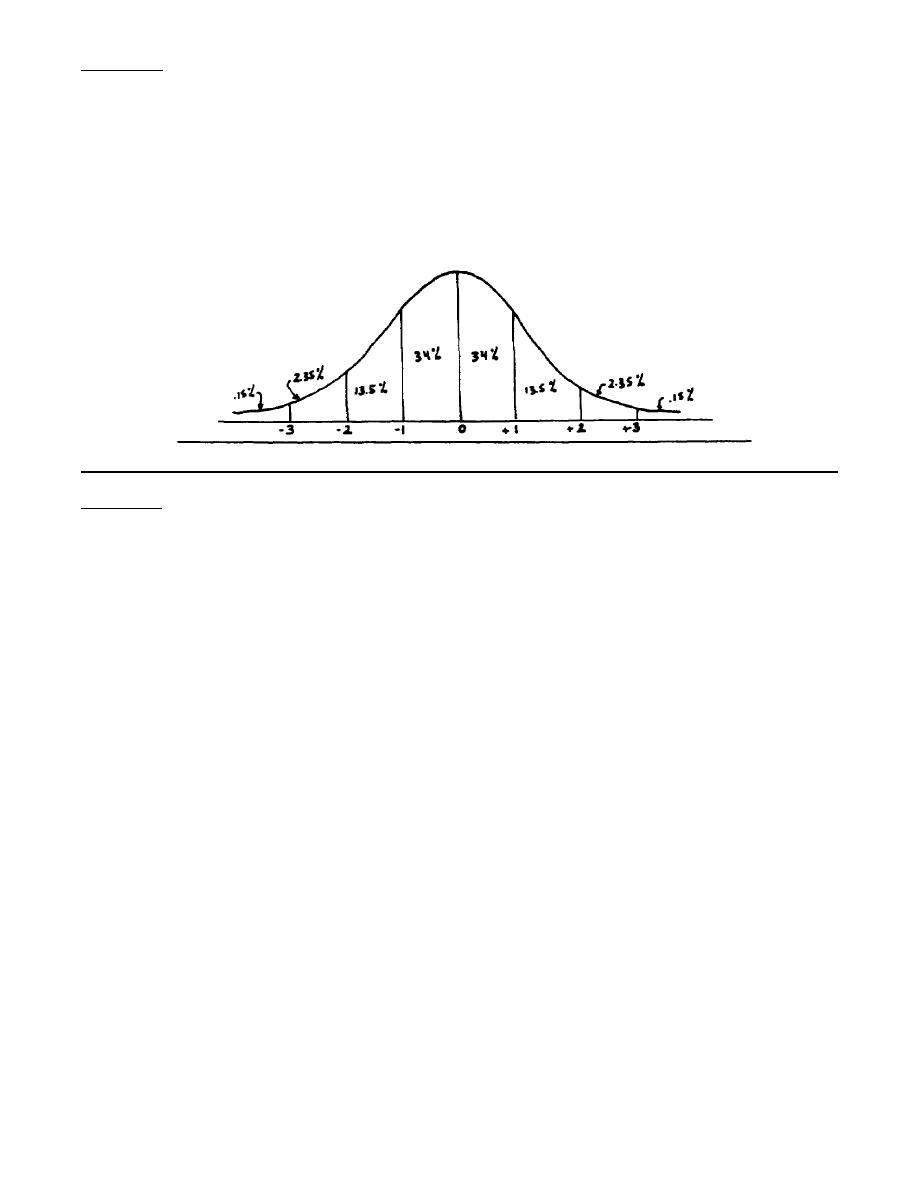
The following diagram shows the areas under the curve for whole standard deviations. You
should be able to compute each of them given only the six characteristics of the normal curve.
Approximate Areas under the
Normal Curve
FRAME 58.
Notice that only the number of standard deviations above (or below) the mean are shown as
the horizontal base line. The symbols u and σ have been deleted because we know that -2
means 2 standard deviations below the mean or u -2σ. To avoid confusion, we will label this new
scale "z" and specify that z = the number of standard deviations from the mean. So, if we say z =
- 3 we know we are talking about a distance of 3 standard deviations to the LEFT of the mean.
QUESTION:
What is the value of z if we are interested in a distance:
a. 1 standard deviation above the mean?
b. 2 standard deviations below the mean?
87
FI0921


 Previous Page
