Lesson 2/Learning Event 2
Minor variations in the CBR test will cause wide variations in the results. For this reason, the step-by-
step procedures are detailed. Difficulties may still arise. Material with gravel or stones does not yield
entirely satisfactory results. You must conduct a number of tests to establish a reasonable average value.
The CBR values range from 0 to 100 depending on the type of soil. The fine-grained soils vary from 3
for organic clays to 15 for micaceous or diatomaceous silts and sands. The sand-silt-clay coarse-grained
combinations range from 10 for the clayey mixtures to 40 for the gravelly and silty sands. Gravelly soils
range from 20 for the clayey group to 80 for the well-graded gravels and gravel-sand mixtures.
SUMMARY OF SAMPLE PREPARATION
1. Oven-dry the sample at less than 140,F.
2. Determine gradation.
3. Replace all +3/4-inch material with an equivalent weight of material passing the 3/4-inch sieve
but retained on the #4 sieve.
4. Compact the sample at the desired moisture content in a CBR mold.
5. Soak for four days and measure swell under surcharge weight.
The object of steps 1 to 3 is to reduce bridging or wedging of large particles in the CBR mold which
could cause non-representative compaction results and high CBR values due to relative sizes of piston,
particles, and mold diameter. In step 4, an attempt is made to simulate levels of compactive effort and
moisture contents obtainable in the field. The soaking (step 5) simulates the worst condition that could
befall the soil-complete saturation. The surcharge weight is used to simulate the effort of overlying
pavement layers on the soil's strength. It is important to note that many of the procedural steps are of an
arbitrary nature which have been compensated for in the flexible pavement design curves. The
standardized test procedures must be followed precisely or the test results may be invalid.
To illustrate the computations required to obtain the CBR value for a soil, the results of two typical
penetration tests shown in Figure 35 will be used. Curve A is representative of results from a test in
which all went well. Although the stress versus penetration plot is not linear, it does approximate this
condition at penetration depths less than 0.30 inch.
At larger penetration depth values, the curve has a decreasing slope indicating plastic failure of the soil.
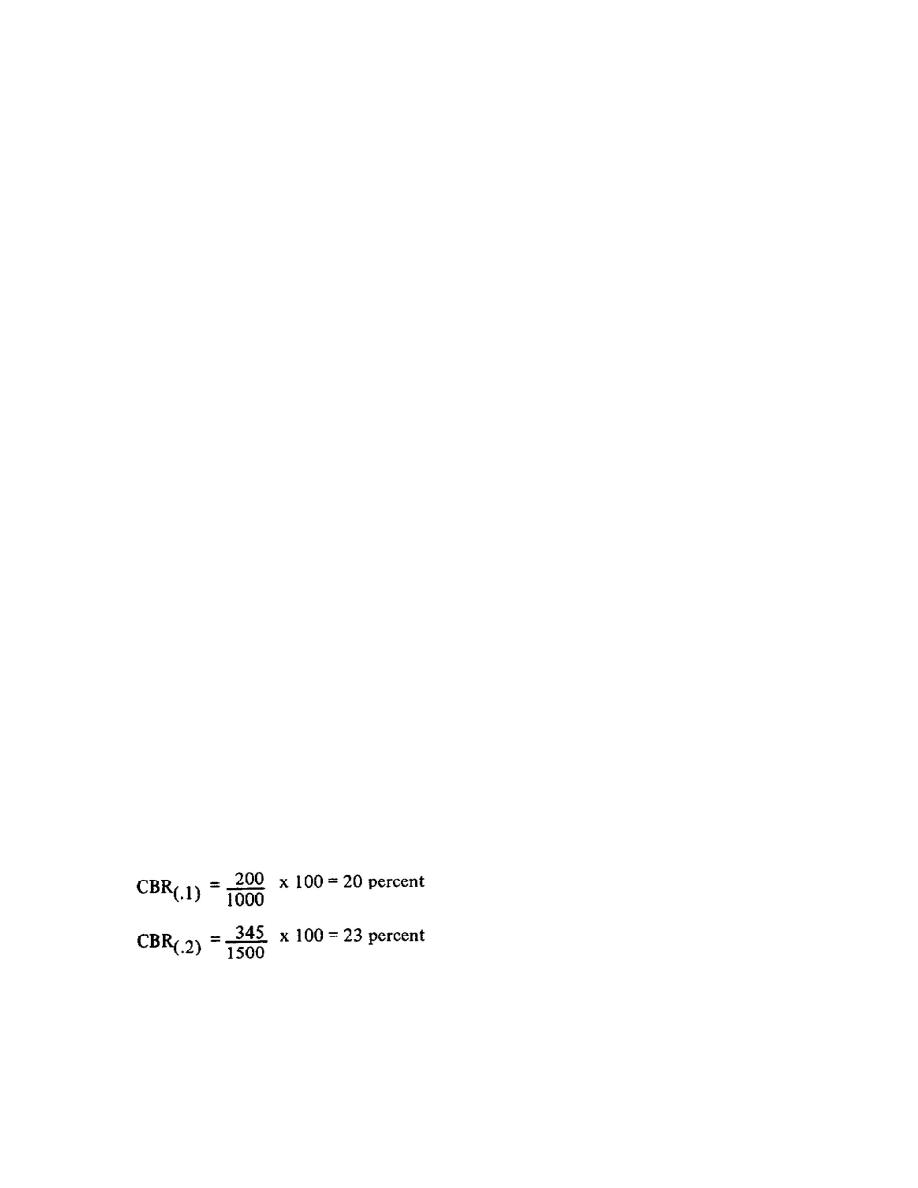
The CBR value is computed by reading the stress values at 0.1 and 0.2 inch penetration and use of
equations 3 and 4 as follows:
114


 Previous Page
