Lesson 1/Learning Event 1
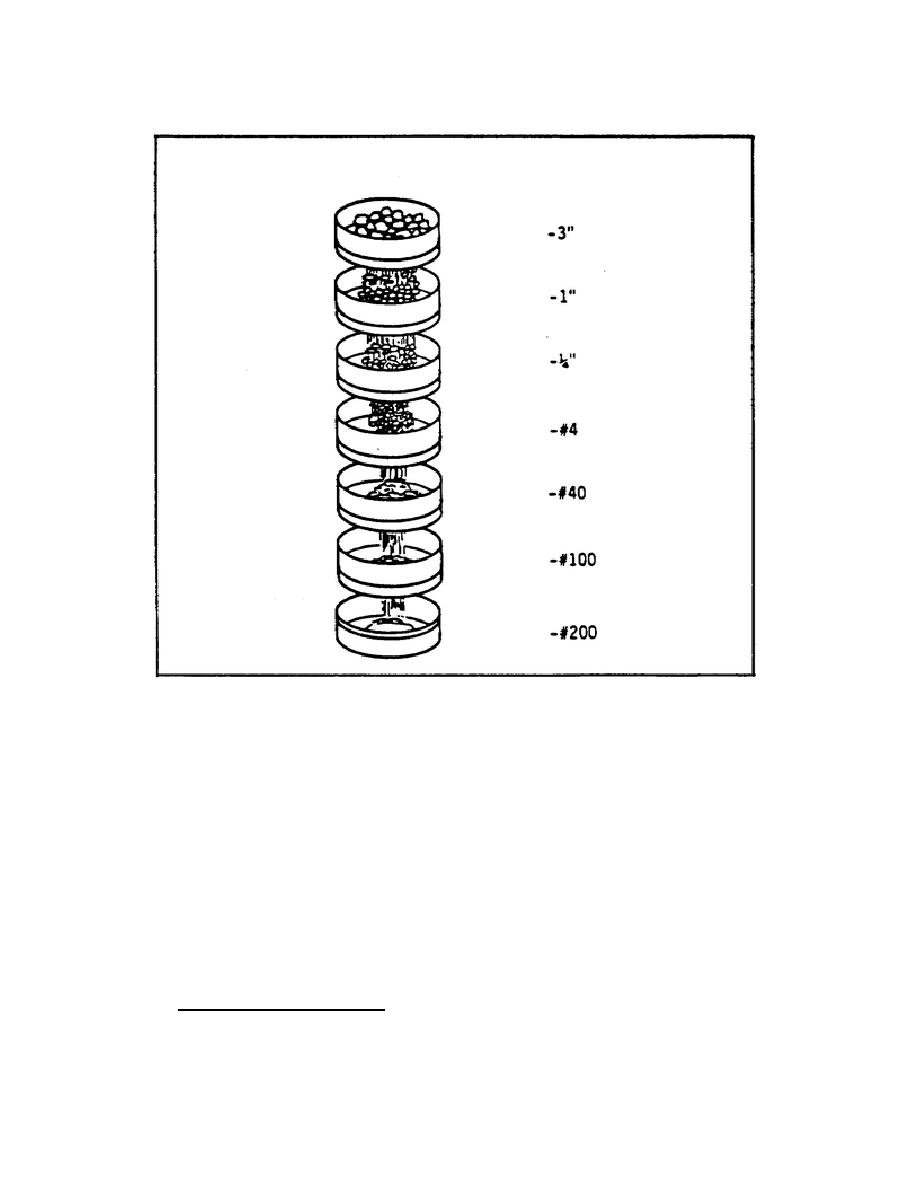
FIGURE 2. A NEST OF SIEVES-COMMON SIEVE SIZES
Weigh the total oven-dry soil sample and then shake the dry, loose material through the nest of sieves.
The sieve analysis may be performed directly upon soils which contain little or no fines, such as a clean
sand, or soils in which the fines may be readily separated from the coarse particles. Soils which have
little dry strength and can be crushed easily in the fingers would generally fall into the latter category. If
the character of the fines is such that the fine material adheres to the coarse particles and is not removed
by dry sieving action, the sample is soaked in water and washed over the #200 sieve. The soil retained
on the #200 sieve is then oven-dried, the washing loss (fines) determined, and the analysis conducted as
before.
Documenting the Results on a Grain Size Distribution Graph
The results of a sieve analysis are recorded either tabularly on a Sieve Analysis Data Form (DD Form
1206), Figure 3, or graphically on a Grain Size Distribution Graph (DD Form 1207), Figure 4. The
tabular form is best used when comparing results to 9 sets of specifications. The graph form permits the
plotting of a grain size distribution curve. This curve illustrates the distribution and range of particle
sizes, and is particularly helpful in determining the soil classification and engineering characteristics.
5


 Previous Page
