FRAME 48.
Fourth, the total area under the curve is one or 100%. All the items in the distribution are
represented under the curve. The normal curve represents the shape of all the observations in
the population.
QUESTION:
Are all the elements of a normal population represented by the normal
curve? ____________________________
FRAME 49.
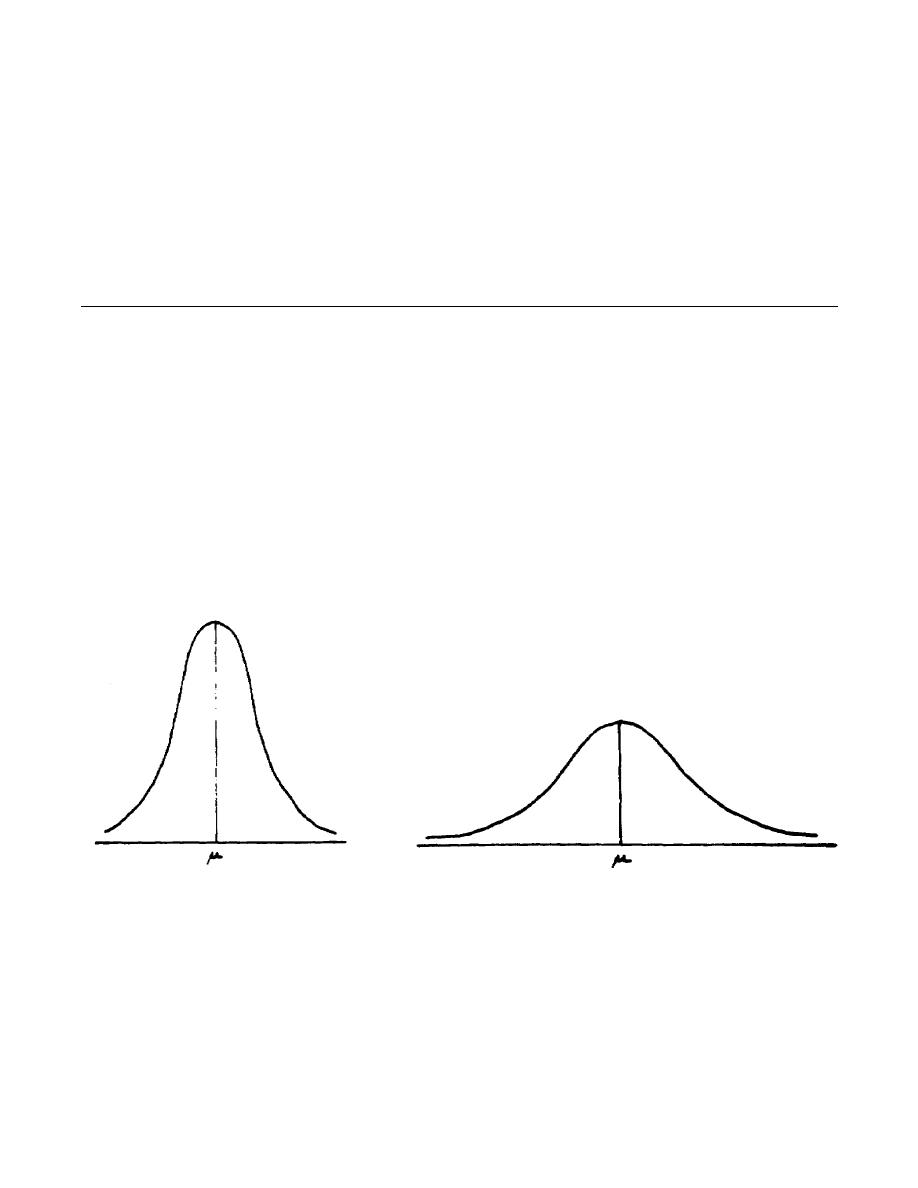
Fifth, the mean and standard deviation completely determine a normal curve. The normal
distribution, is a two-parameter distribution. In order to draw any normal distribution, all we need
are the mean and standard deviation. All normal curves with the SAME mean and standard
deviation are identical. We previously defined standard deviation as a unit of measure of
dispersion. The more spread out the data, the greater the dispersion, and thus the larger the
standard deviation. As the standard deviation gets larger, the normal curve tends to flatten out.
Which of the following normal curves has the larger standard deviation?
CURVE A
CURVE B
73
FI0921


 Previous Page
