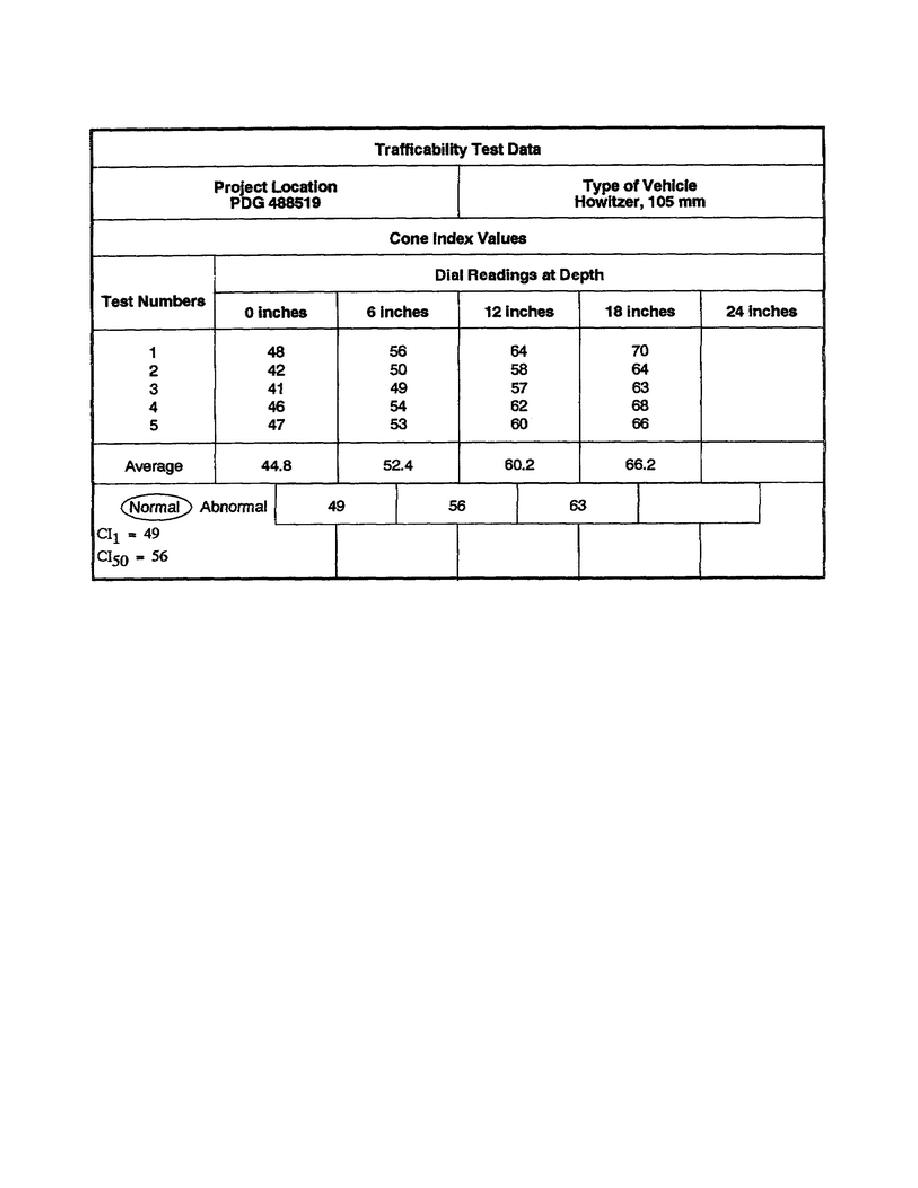
Table 3-4. Recording CI values
averaged (see table 3-4). In order to arrive at the CI of a 6-inch layer of soil, the average values of the top and
bottom levels of that soil must themselves be averaged. Table 3-4 shows that the soil layer occurring at a depth
of-
0 to 6 inches has a CI of 49 ((44.8 + 52.4/2).
6 inches to 12 inches has a CI of 56 ((52.4 + 60.2)/2).
12 inches to 18 inches has a CI of 63 ((60.2 + 66.2)/2).
Under most circumstances, the CI will increase or remain constant with depth, resulting in a normal soil profile.
However, in some cases, a reversal in this trend occurs, and the soil is said to have an abnormal soil profile. The
type of soil profile present in the test area is indicated on the chart of CI values (see table 3-4).
Finally, the CI value for the critical layer corresponding to one pass of the design vehicle as well as the CI value
corresponding to 50 passes of the design vehicle are entered into the chart of CI values. For example, the critical
layer for one pass of a 105-millimeter howitzer over fine-grained soil is 0 to 6 inches, while the critical layer for
50 passes of the same vehicle is 6 inches to 12 inches (see Lesson 3.E.2.b.(1)(c) page 3-27). Therefore, the
corresponding CI values for these two layers are entered into the chart as CI1 and CI50 respectively (see table 3-4).
EN5341
3-30


 Previous Page
