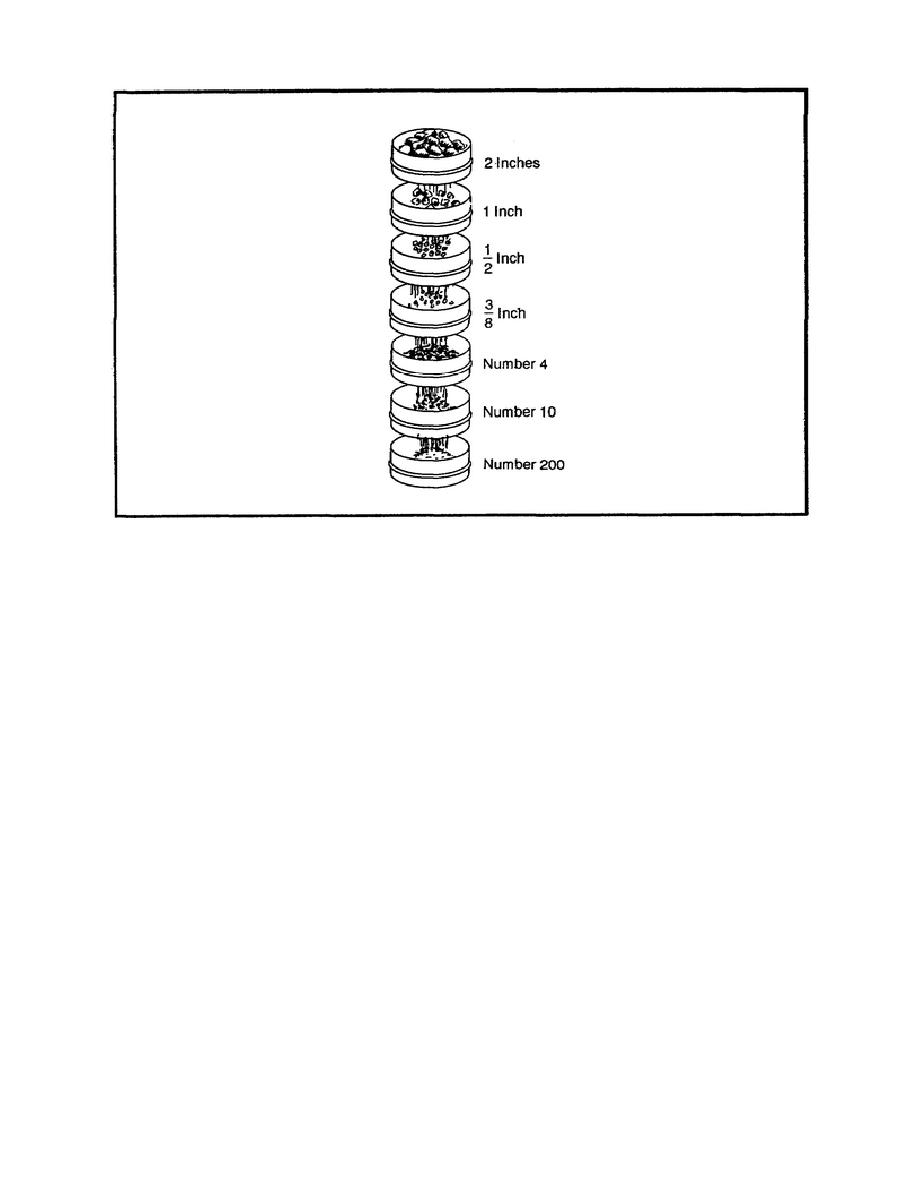
Figure 3-2. Dry sieve analysis
conducted as explained above. The results of a sieve analysis may be recorded graphically using DD Form 1207
(see figure 3-3).
The horizontal axis of this chart is used to plot the various sieve sizes used in the analysis, while the percentage of
material passing each of those sieves is plotted on the vertical axis. Once points have been established on the
graph using this procedure, they may be connected by a line, called the grain size distribution curve. This curve
allows for the ready visualization of the distribution of particle sizes within a particular soil. It is important to
note that gravel-sized particles are represented by the portion of the curve that lies to the left of the vertical line
signifying the US Standard Number 4 sieve size; sand-sized particles are represented by the portion of the curve
that lies between the vertical lines signifying the Number 4 and Number 200 sieve sizes; and fines (silts and clays)
are represented by the portion of the curve that lies to the right of the vertical line signifying the Number 200
sieve size.
b. Settling Tube (Wet Mechanical) Analysis. The US Standard Number 200 sieve size is, for all practical
purposes, the lower limit for use in sieve analysis. Because the Number 200 sieve size allows the passage of both
silt- and clay-sized particles, an alternate method for the further classification of fine-grained materials is
required. One such method is the settling tube (wet mechanical) analysis method, which operates on the principle
that relatively large particles settle from suspension in water exponentially faster than smaller particles.
Following this principle, water may be added to a fine-grained soil and the mixture agitated so that individual soil
particles become suspended. The sedimentation rates of the particles may then be recorded and used to determine
particle sizes.
EN5341
3-6


 Previous Page
