Lesson 1/Learning Event 3
If a soil then has a liquid limit of 25 and a plastic limit of 10, its plasticity index would be 15. In
practice, engineers use the plasticity index coupled with the liquid limit as indexes to the properties of
soil. Since clay is the material which causes a soil to be plastic, it would be expected that a fine soil
mixture that is predominantly clay would have a larger plasticity index than a mixture which is
predominantly silt or fine sand. The former also would be more likely to produce greater volume
changes with varying moisture contents than the more "lean" mixture of low plasticity. A nonplastic
soil (PI = ), on the other hand, would probably be even less affected by moisture than the "lean" soil of
low plasticity.
THE CASAGRANDE PLASTICITY CHART
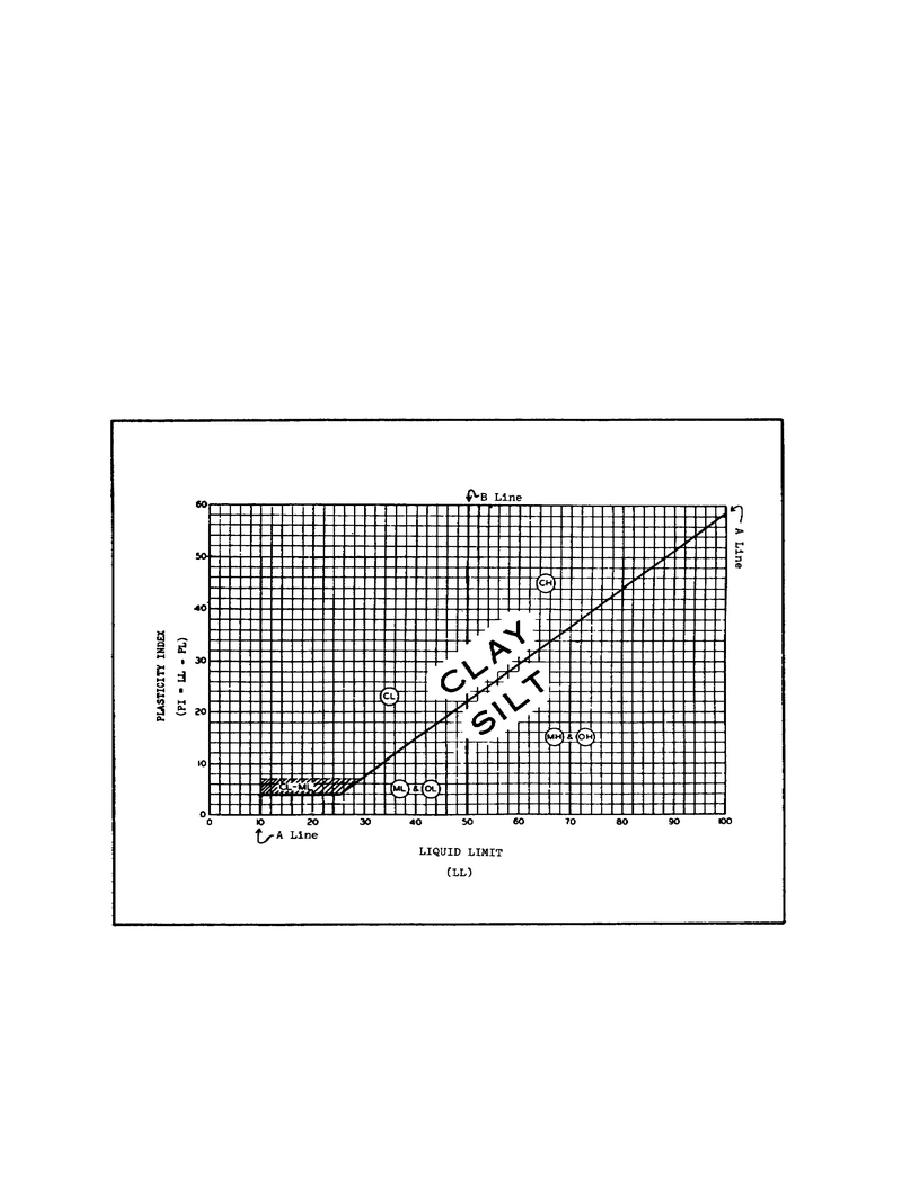
The Casagrande Plasticity Chart is made by plotting the plasticity index versus the liquid limit. The
Plasticity Chart (Figure 11) will provide you with a method for determining the type of fines.
FIGURE 11. PLASTICITY CHART
The A-line on the Plasticity Chart separates the clays from the silts. Any material whose values of PI vs.
LL plot on the A-line or above will be classi-
17


 Previous Page
